Lecture 4:
An Introduction to North America
Suggested Readings:
One of the best single-volume introductions to geology currently available is Stephen Marshak, Earth: Portrait of a Planet. Few sciences are more helpful than geology for learning to read the many ways natural processes shape the landscapes we inhabit.
USGS, The National Atlas (1970). This was last published as a remarkably beautiful and comprehensive volume in 1970, which you can find in various locations on the UW-Madison campus, including the Historical Society and Map libraries. Many of the maps used in this lecture, and many others besides, can be found by browsing this wonderful atlas. It has been scanned and is available online in at least two different locations:
The Library of Congress (probably easiest to navigate): https://www.loc.gov/resource/g3701gm.gct00013?st=gallery&c=160
The Perry-Castañeda Library Map Collection at the University of Texas-Austin: https://www.lib.utexas.edu/maps/national_atlas_1970.html (a little more challenging to use).
The National Map continues online at the USGS website at http://nationalmap.gov, but it can be remarkably difficult for mere mortals to navigate.
The Library of Congress has some of the best available map collections, which can be helpful to browse both for this lecture and for many others over the course of the semester. The following links may be worth bookmarking and browsing when you have time:
https://www.loc.gov/maps/collections/
https://www.loc.gov/rr/geogmap/guides.html
https://www.loc.gov/rr/geogmap/guide/ (a very helpful online introduction to maps and their histories)
Finally, remember that you can (and should!) access online a classic collection of historical maps for many of the topics discussed in this course in Charles O. Paullin's 1932 Atlas of the Historical Geography of the United States at http://dsl.richmond.edu/historicalatlas/
NB: Although we won't try to provide links for all of the maps shown in lecture, we will provide a few links in the notes below to maps that are especially helpful in anchoring the lecture's major concepts.
Also, you'll find at the bottom of this page a list of geographical features you'd be well advised to learn and be able to locate on a map.
IMPORTANT: Finally, if you start to feel overwhelmed by the sheer volume of detail in the maps that are linked in the notes below--and it's very likely that you will start to feel overwhelmed unless you already have a strong geographical knowlege of North America--please remember that you do not need to try to stuff all of this information into your brain to regurgitate on the exams! Your task is rather to peruse these materials in search of the general patterns of geology, climate, ecology, topography, and regional physiography that have shaped the history of human life and the making of landscapes in North America. You should regard the many links to maps below as invitations to wander and explore on your own in search of these underlying geographical patterns (which are quite fascinating in their own right, and far more important to history and American life than most people recognize), and also to see how places you know or have heard about relate to the nation and continent as a whole. Your goal should be to approach these maps in a spirit of play and to have fun exploring. We really mean this!!I. A Few Thoughts on Maps, Space, and Time
This extraordinary map, hand-drawn in pen and ink, was created by Erwin Raisz in 1954:
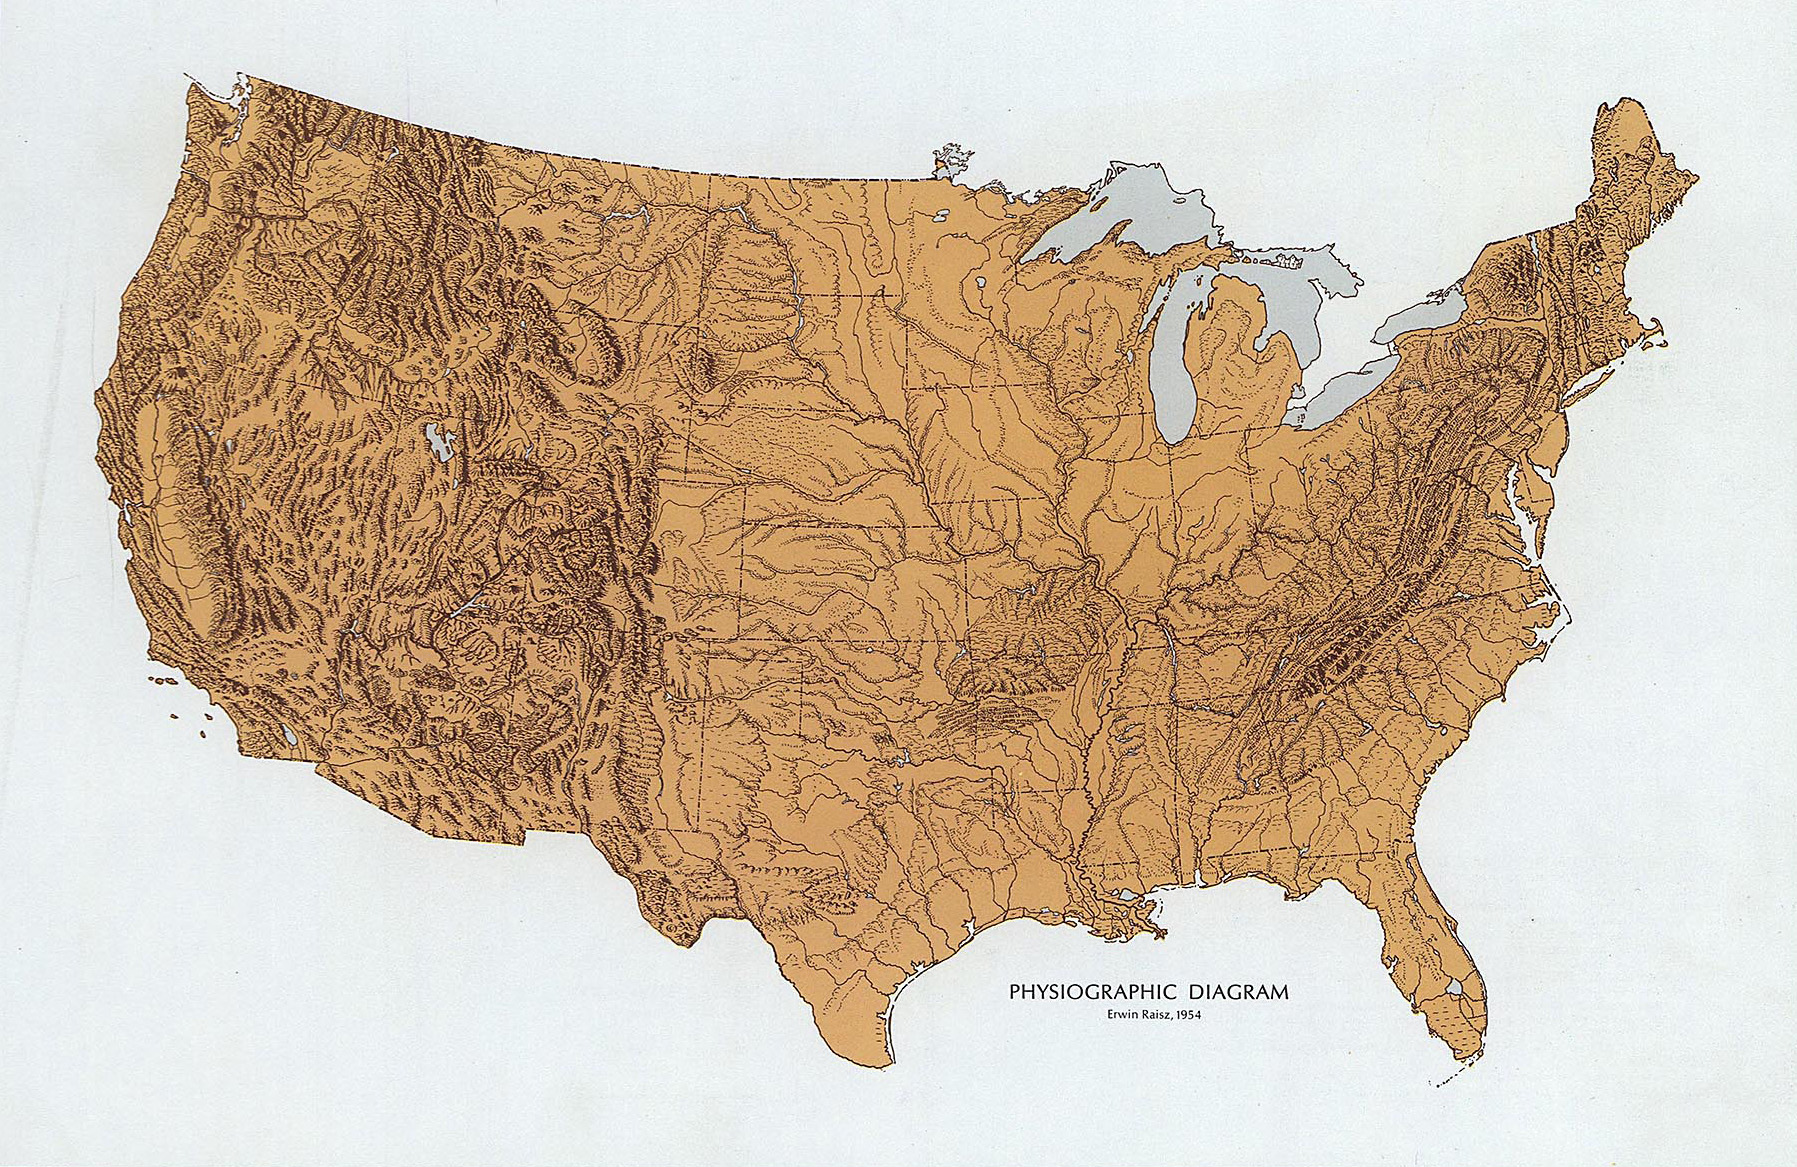 "Erwin Raisz's Landform Outline Map of the United States, 1954, National Atlas Version, 1970"
Erwin Raisz was born in Hungary in 1893, the child of a civil engineer. Trained in Budapest in civil engineering and architecture, he served in World War I, then migrated to New York City in 1923, where he earned his Ph.D. in Geology at Columbia University in 1929. He was hired by Harvard's Institute of Geographical Exploration in 1931, serving as curator of its map collection for next 20 years. Raisz authored the first general textbook on cartography in English in 1938: General Cartography (available online for free download at https://archive.org/details/in.ernet.dli.2015.174639). The book exemplifies Raisz's remarkable output of maps, mainly in black-and-white drawn in pen and ink, a powerful reminder in this digital age of what a discerning eye and skillful hand can accomplish on a sheet of paper.
You'll see this map on the midterm exam, possibly the final as well, so get to know it well.
Raisz's map invites us to make a few key observations about scale:
The larger the scale of a map—either on paper, or digitally--the more information it can contain. On large-scale maps (e.g., 1 mile to the inch), objects appear larger and can contain more detail; on small-scale maps (e.g., 100 miles to the inch), objects appear smaller and contain less detail. Map making always involves compromises between the amount of detail a map can contain and its legibility. You have to remember cartographic details in your own mind because no map can contain all of them at once.
This means also that mapmakers make a series of selective judgments about which pieces of information they will reveal on a particular map, and which others (the vast majority) they will suppress.
Today's lecture is a whirlwind tour of the United States and the North American continent more broadly, using a wide variety maps to help us think about geographical relationships. Recall again the title of this course: "The Making of the American Landscape." Today's class focuses on trying to answer the following far-reaching question: What geological, ecological, and climatological processes have shaped the North American landscape, both during the 500 years on which we focus in this class, and far beyond that time as well?
We aren't asking you to remember all the details in this introduction to North American geology/ecology/climatology/glaciology/… etc., but instead the general categories of information that can be represented spatially on maps, and what those processes of physical change mean for different parts of the country. We'll talk a lot about maps in our next two discussion sections, and you'll be going to the map library (and consulting maps online) to try to anchor some of the ideas from this lecture today.
*Raisz's Landforms of North America (MUCH larger scale)
Raisz's schematic map of North America reminds us of the number of features that most U.S. citizens perceive only within the boundaries of the United States but are in reality profoundly tied to Canadian places and processes as well. Although we won't have time in this course to do full justice to the Canadian sides of the many stories we'll be exploring, I'll try to gesture across our northern border every so often to remind you of these shared processes.
Notice on this map: the broad valley comprising the central United States is drained almost entirely by the Mississippi River and its tributaries, and bound by the Allegheny Mountains to the east and the Rocky Mountains to the west.
*Raisz's Landforms of the United States with cross-section
Although we tend to think of maps horizontally, they sometimes seek to portray vertical elevation as well; this Raisz map seeks to do both. Work to keep this cross-section in your head.
*Shaded relief map of U.S., USGS, 1969
https://www.lib.utexas.edu/maps/national_atlas_1970/ca000045.jpg
Here's a more familiar way that vertical elevation gets represented, here in a color shaded relief map from the USGS National Atlas project in 1969. On a map like this, a common cartographic conventions is that low-lying areas are represented in green, and become more brown as you rise in elevation. We're so used to this convention that we interpret many maps this way without much thought.
*Thelin & Pike, Landforms of the conterminous United States, USGS, 1991
http://pubs.usgs.gov/imap/i2206/
...and here in a later USGS project from 1991, a stunning use of digital elevation data produces a shaded B&W relief map in which even quite subtle physical features almost leap off the map for you to ponder, based only on their elevation. We can see in this map, for example:
- Appalachian Mountains
- Rocky Mountains
- Mississippi Delta
- Grand Canyon
- Salton Sea
- Driftless Area
- Glacial Lake Wisconsin
- Yellowstone National Park and its geological origins in a hot spot path in the mantle that produced immense basalt flows from what is today Washington State to present-day Yellowstone.
This map, in other words, lets us think at both the scale of the continent and at the scale of discrete features within a geologically shifting continent.
*Outline Map of U.S. without state names
No state names: http://nationalmap.gov/small_scale/printable/images/pdf/outline/states(u).pdf
State names: http://nationalmap.gov/small_scale/printable/images/pdf/outline/states.pdf
In this course, we'd like you to be able to add the names of states to this map. If you're a U.S. citizen, you'd probably be hard-pressed to add the names of more than one or two or three Canadian provinces to this map and although Canadian geography won't be a primary focus of this course, it's knowledge I'd encourage you to learn, if only as a citizen of this nation about our most important neighbor and largest single trading partner. A future lecture will speak at greater length about how various place names like the names of these states and provinces and many smaller places were gradually added to the map of North America.
II. Understanding the Continent through Many Geographical Lenses
*Relief map of North America
https://store.usgs.gov/assets/yimages/PDF/112733.pdf
Miscellaneous climate maps from the National Atlas of 1970:
Monthly Sunshine: http://www.lib.utexas.edu/maps/national_atlas_1970/ca000072.jpg
Solar Radiation: http://www.lib.utexas.edu/maps/national_atlas_1970/ca000071.jpg
Monthly Average Temperature: http://www.lib.utexas.edu/maps/national_atlas_1970/ca000078.jpg
Monthly Maximum Temperature: http://www.lib.utexas.edu/maps/national_atlas_1970/ca000079.jpg
Monthly Minimum Temperature: http://www.lib.utexas.edu/maps/national_atlas_1970/ca000076.jpg
Precipitation: http://www.lib.utexas.edu/maps/national_atlas_1970/ca000080.jpg
Snowfall: http://www.lib.utexas.edu/maps/national_atlas_1970/ca000074.jpg
Monthly Precipitation: http://www.lib.utexas.edu/maps/national_atlas_1970/ca000075.jpg
So: how can we go about learning how to think about the place represented by this map? One way to answer that question is to remind ourselves of a crucial feature of this planet that affects every aspect of human life: because the planet spins on its axis at a 23.5º tilt creates seasonal cycles almost everywhere except the tropics. The fact of seasonality in mid and high northern and southern latitudes (though not nearly so much at the Equator) has myriad consequences for how we live: for example, the sloping of roofs in northern latitudes to shed snow is a feature you would see less readily in Mexican domestic architecture. So one question we'll ask in this class has to do with how human habitation and settlement have been shaped by temperature shifts that vary with latitude and elevation.
Another key climatic feature is wind. If the tilted earth gives us our seasonal temperature fluctuations, the spinning earth helps produce the shifting winds we experience; without spinning, we would simply see heat cells that rise and fall. The Coriolis Effect gives easterly and westerly directions to the winds rising off the Equator. What matters for us in the U.S. is that in our latitudes we experience the Prevailing Westerlies, with weather patterns generally moving from west to east in the part of the planet we inhabit.
Combine temperature with prevailing winds and ask: "Where are the biggest sources of moisture in different regions of the Earth?" When combined with the distribution of surface waters, general patterns of precipitation (rain, snow, fog) emerge that dramatically affect all plant and animal life in different regions and locations. One consequence is that the western half of the U.S. is much drier than the eastern half. Agriculture without irrigation requires approximately 20 inches of annual precipitation. The 20-inch annual precipitation line—which falls near the 100th Meridian, near the eastern margins of the Great Plains—divides the U.S. into starkly different regions where agriculture is either possible and almost impossible without irrigation. This climatalogical fact has important implications historically: early English and French settlements in the U.S., for example, sprang up in places where precipitation was plentiful. Exceptions to this generalization about the general aridity of the U.S. West occur west of major mountain ranges (see the Pacific Northwest, the Californian Central Valley) via the rain-shadow effect.
Water that falls from the sky, whether as summer rain or accumulating winter snow, combines with terrain to affect the distribution of flowing water on the surface of the planet. Diminishing or increasingly erratic snowpacks in the western part of the U.S. combined with climate change may mean that flows of surface water will become less reliable in the future.
*Continental Divides of North America
Continental divides are major suture lines of the continent: lines dilineating where water will flow when it falls. These divides give us the major water basins of the U.S..
https://store.usgs.gov/assets/MOD/StoreFiles/PDF/101515.pdf
It's really important that you learn the names and locations of at least a handful of major rivers and watersheds in the United States and Canada:
Mississippi
Missouri
St. Lawrence
Ohio
Columbia
Snake
Colorado
Yukon
Here are a couple links to maps that do a reasonably good job of identifying significant rivers in North America:
http://lizardpoint.com/geography/images/maps/usa-rivers-labeled.gif
Recall that water was the primary means of transportation before rail, so the flow of rivers and points of connection between water basins at places like Portage, Wisconsin—as we saw in the introductory lecture—had great economic and cultural significance historically.
*Mississippi Watershed
https://en.wikipedia.org/wiki/Mississippi_River#/media/File:Mississippiriver-new-01.png
Notice the enormous volume of water flowing through the Mississippi, particularly in contrast to the Colorado. An important skill in reading maps is learning to recognize watersheds in addition to mountains and valleys on maps.
Combine elevation with rivers, and we can begin to generalize about major physiographic regions of the United States, i.e. areas that share some common geographic features and patterns.
*Topographic relief map of U.S., USGS, 1969
https://www.lib.utexas.edu/maps/national_atlas_1970/ca000043.jpg https://www.lib.utexas.edu/maps/national_atlas_1970/ca000045.jpg
This class will encourage you to think about the different journeys water makes to reach the sea. This map reminds you of just how low Wisconsin is, with the entire flow of the Great Lakes region dropping just 600 feet.
We are also left with this question: How do we divide areas into physiographic provinces, i.e. areas that share some common geographic features and patterns? One of the first people to trying doing this was John Wesley Powell, one of the great explorers of the Colorado River. Here is a list of physiographic provinces that Powell began to map out and we can still make use of today:
*National Atlas pages on shaded relief, Raisz landforms, and physiographic provinces
http://www.lib.utexas.edu/maps/national_atlas_1970/ca000046.jpg http://www.lib.utexas.edu/maps/national_atlas_1970/ca000045.jpg
- The Atlantic Plains/the Coastal Plains
- Appalachian Highlands
- Central Lowlands (and Mississippi Valley)
- Great Plains
- Rocky Mountains
- Colorado Plateau
- Sierra Nevada Mountains
- Pacific Mountain System
- Cascade Mountains
*National Atlas map of Küchler's Potential Vegetation of the United States
http://www.lib.utexas.edu/maps/national_atlas_1970/ca000069.jpg
All the geographical features we've named thus far have profound influence on the plants, animals, and ecosystems that flourish in any given area of the continent:
- East: Deciduous forests in the south, coniferous forests in the north
- Central US: fewer trees and more grasslands as rainfall diminishes toward west.
- Forests of the Rocky Mountain peaks
- Deserts of the Southwest and Great Basin
- California, which has all extremes
- Rain forests of coastal Pacific Northwest, British Columbia, and Alaska
These factors help dictate what can grow where—plants, animals, and people. These factors help dictate what can grow where—plants, animals, and people. The roles they have played in the making of the American landscape--and indeed, the making of the American nation--are difficult to overestimate.
III. Thinking about the Underground Continent and Its Geological History
Of all the sciences to familiarize yourself with reading the landscape, geology and plant ecology are among the most important. Geology can help explain much this lecture has described so far—though because this is not a geology course, we'll offer only the most basic of overviews.
Maps of natural resources underground show the spatial distribution of features that have shaped American history. Example: map of coalfields in North America; map of oil and gas production in the US.
Note that this class relies on deep time—an earth that is 4.5 billion years old—and several assumptions are foundational to the science of geology because it seeks to describe processes central to the making of landscape: mountain-building, the weathering and erosion of rock formations, etc. We take the following as givens in this course when we refer to geological processes:
-
James Hutton's doctrine of "uniformitarianism," which argues that processes happening today were also happening in the past, and that small processes going on all around us can have enormous impacts on landscapes if given enough time;
- A correlate of this argument is the geological assumption of "deep time": the Earth is very old (we now think on the order of 4.5 billion years), and enormous changes have occurred over that long sweep of time.
- The evolution of life (especially multicellular life from the Cambrian era forward) has produced a fossil record that plays a very important role in providing the chronological sequences with which rock strata are dated, so that whole geological eras can sometimes be defined by their characteristic fossils. (Dating with radioactive isotopes can provide absolute chronologies that go much further back in time.)
-
Plate tectonics adds the further argument that the continents and oceans are underlain by plates of the crust that float on the Earth's mantle and gradually shift position both relative to each other and relative to lines of latitude on the spinning Earth over the course of millennia.
This course treats these insights as given when referring to various geological processes, with apologies to any for whom such assumptions contradict their theological beliefs.
What Darwin's theory of evolution did for biology in the nineteenth century, plate tectonics did for geology starting in the early 20th century. Alfred Wegener (1880-1930) proposed the idea of continental drift in 1912, publishing the first book on this subject in 1915: The Origin of Continents and Oceans (Die Entstehung der Kontinente und Ozeane). The idea that the continents moved around struck many as absurd. The book went through multiple editions, adding new evidence up until the last edition in 1929. Wegener died on an expedition to Greenland in 1930 with few scientists taking his theory seriously. It would take Cold War research and politics (especially the mapping during the 1950s and 1960s of the ocean floor) for his theory to become widely accepted, revolutionizing the earth sciences when it did.
In this class, it's helpful to understand continental uplift, subduction, and the movement of tectonic plates as we seek to understand the origins of mountains, which affect many aspects of North America: watersheds, climate, agriculture, mineral resources, etc. The boundaries of the planet's tectonic plates are mostly mid-oceanic, but there are important plate boundaries--for instance, along the west coast of the United States and Canada--that have huge implications for the landscape.
(For a general overview, with a number of good diagrams, see: https://en.wikipedia.org/wiki/Plate_tectonics)
Let's zoom into the Western U.S.: this is where the Pacific Plate is moving laterally relative to the North American plate, and where the Juan de Fuca plate is subducting beneath the North American plate in the Pacific Northwest, producing the series of volcanoes we know as the Cascade Mountains. The high silica content of the crustal material in their magma makes it sticky, yielding the explosive eruptions we associate with Mt. St. Helens in 1980. The San Andreas Fault (which caused the 1906 San Francisco Earthquake) and the Hayward Fault in Hayward, CA, are among the most dramatic examples of plate movement we can observe at first hand in the American landscape.
IV. Shallower Deep Time and Our Home Ground of Wisconsin
To understand the landscape, we also have to think about shallower deep time, which dramatically affects our experience of landscape right here in Wisconsin: the movement of ice sheets.
Our planet doesn't just spin on a tilted axis; it wobbles, and wobbling has for the past million years and more contributed to recurring advances and retreats of continental ice sheets, glaciers a mile or more thick. These changes have profoundly shaped the ground on which we're sitting right now.
23,000 years ago, this region saw the advance of the most recent major glaciation, called the Wisconsin because of the geological work that was done here at this university in the 19th century to describe it. That glacier only retreated about 13,000 years ago, so the Wisconsin landscape is very young by geological standards. Bascom Hill itself is a drumlin, formed underneath the ice about 18,000 years ago. The fertile lands around Milwaukee are rock material largely carried south from Canada and northern Wisconsin in the last glacial period.
Here's a great series of thematic maps about Wisconsin's topography, geology, and vegetation from the Wisconsin Geological and Natural History Survey (WGNHS). Just click on the thumbnails to enlarge and download them. They're well worth keeping on hand for reference:
Bedrock Stratigraphic Units in Wisconsin: https://wgnhs.uwex.edu/pubs/000200/
Landscapes of Wisconsin: http://wgnhs.uwex.edu/pubs/m146/
Landforms of Wisconsin: http://wgnhs.uwex.edu/pubs/m042/
Bedrock Geology of Wisconsin: http://wgnhs.uwex.edu/pubs/download_m067/
Ice Age Deposits of Wisconsin: http://wgnhs.uwex.edu/pubs/download_m034/
Early Vegetation of Wisconsin: http://wgnhs.uwex.edu/pubs/m035/
And this PDF includes a series of maps showing the position of the glacial ice in the state at various moments during the Wisconsin glaciation: D. M. Mickelson and J. W. Attig, "Laurentide Ice Sheet: Ice-Margin Positions in Wisconsin," Wisconsin Geological and Natural History Survey (2016): https://wgnhs.uwex.edu/pubs/es056/
Let's return to the 1991 USGS map: http://pubs.usgs.gov/imap/i2206/
You can see on this topographic map the bed of Glacial Lake Wisconsin, and the Wisconsin Dells that were carved by when the glacial lake broke and drained in a week. This kind of reading the landscape—geologically, and as represented on maps—are among of the skills we'll be learning in this course.
V. Questions You Can Usefully Ask of Any Place or Landscape
By way of summary, here are some questions that are likely to yield useful insights about any place or landscape you happen to be trying to understand:
- What’s your latitude and what does it mean for your seasons?
- What watershed are you in, and what route does water take to reach the sea?
- What’s your elevation, and what are the highest and lowest points nearby?
- Where does your weather come from?
- What are your annual highs and lows of temperature and precipitation?
- What physiographic province are you in?
- What’s the dominant vegetation in this landscape?
- What kinds of rock and soils are under your feet?
- What tectonic and geological processes have affected your local geology?
- And so on and on....
Appendix: Geographical Features You Should Know
The list below includes places that are likely to come up over the course of the semester, and the more easily you can locate them on a map, the better able you will be to recognize their significance for the history of the American landscape. You won't be at risk to remember all of these on the exams for this class--not all of them will manage to find their way into lectures--but a number of them will show up, so keeping an eye out for them and trying to remember where they are will unquestionably serve you well.
Physiographic Regions
Coastal Plain
Piedmont
Appalachians
Adirondacks
Great Lakes
Central Lowland
Great Plains
Rocky Mountains
Colorado Plateau
Wyoming Basin
Basin & Range
Sierra Nevada
Cascade Mountains
Columbia Plateau
Coast Ranges
Central Valley, Imperial Valley
Salton Sea
Black Hills
Canadian Shield
Rivers:
St. Lawrence
Connecticut
Hudson, Mohawk
Susquehanna
Ottawa (in Canada)
Potomac, Shenandoah
Ohio
Tennessee
Mississippi
Wisconsin
Red River of the North
Missouri
Yellowstone
Arkansas
Platte
Snake
Colorado
Gila
Rio Grande
Sacramento
San Joaquin
Humboldt
Columbia
Willamette
Yukon
Mackenzie (in Canada)
Place Names of Historic Significance in U.S. Landscape History:
all of the states
the names of the Great Lakes
New York City
Chicago
Pueblo villages
Santa Fe
Tucson
Monterey
San Francisco
Virginia City (the Comstock)
Los Angeles
Quebec
Montreal
Cahokia
New Orleans
St. Louis
Jamestown
Plymouth
Albany (Fort Orange)
Pittsburgh
Cincinnati
San Antonio
Salt Lake City
South Pass (Wyoming)
Yellowstone
Phoenix
Grand Canyon
Las Vegas
Yosemite
Portland
Seattle
General Concepts to Remember:
line of 20" rainfall (100th Meridian, eastern Great Plains)
general precipitation and temperature patterns
general vegetation areas